
TEMPLATES & BUSINESS WORKFLOWS
How to Create a Monthly Management Report in Excel
Create a clear monthly management report in Excel that summarizes key results, major variances, operational updates, and next actions.
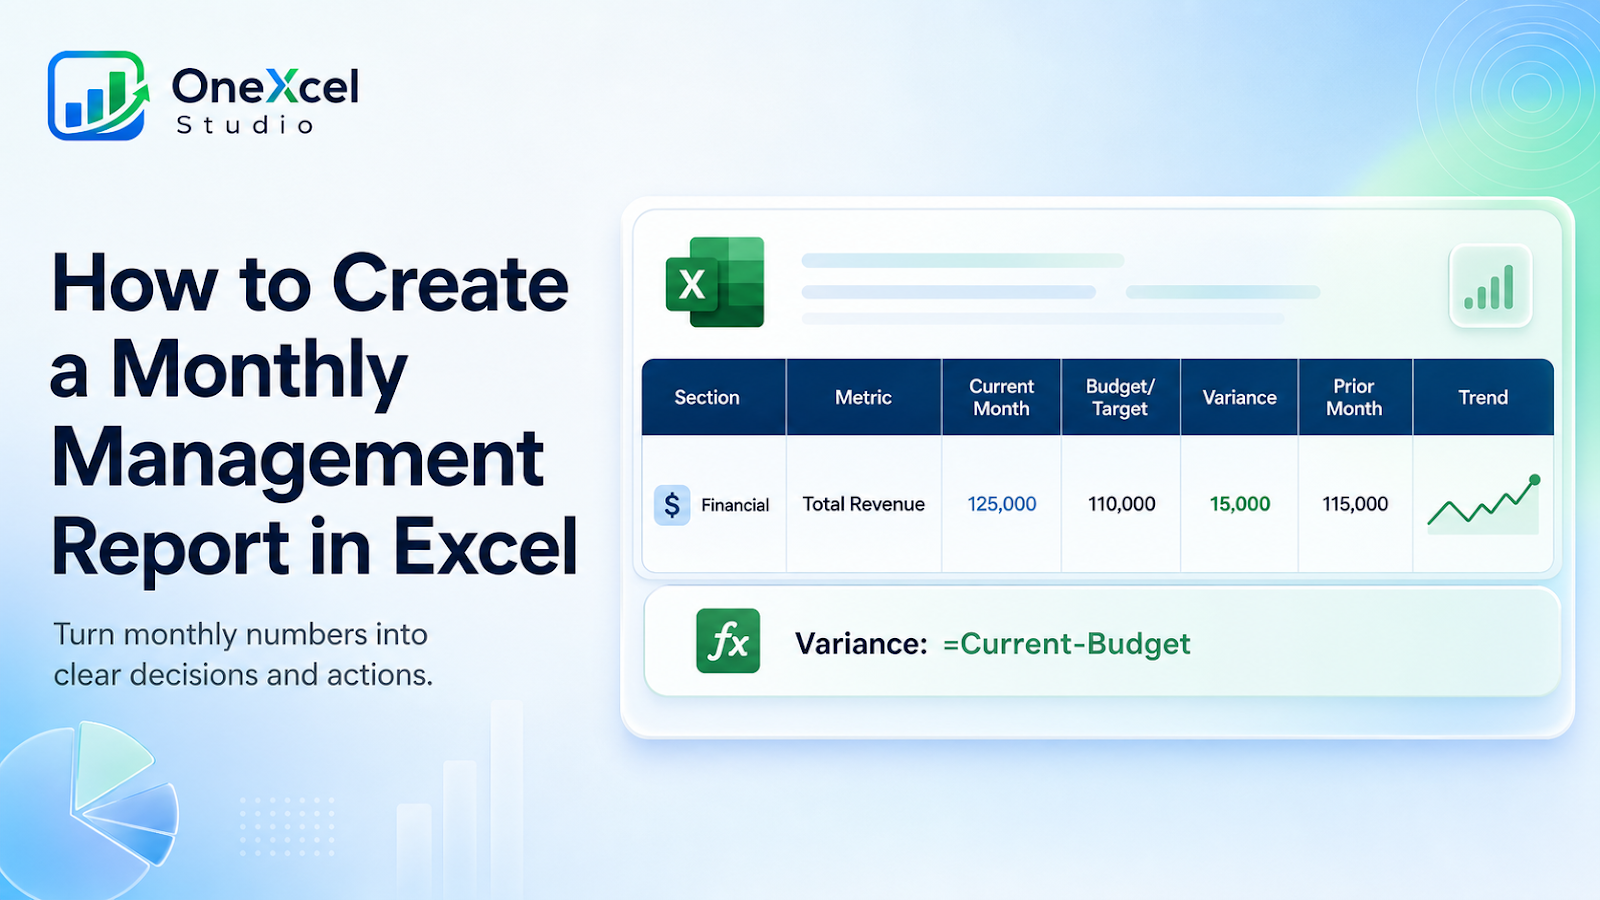
Recommended tracker fields
| Field | Purpose |
|---|---|
| Section | Report grouping such as Financial Results, Operations, or Risks so readers can scan related measures together. |
| Metric | Headline KPI or line item that management needs to review for the period. |
| Current Month | Current-period reported result reconciled to the approved source. |
| Budget/Target | Approved comparison point used to judge the current result. |
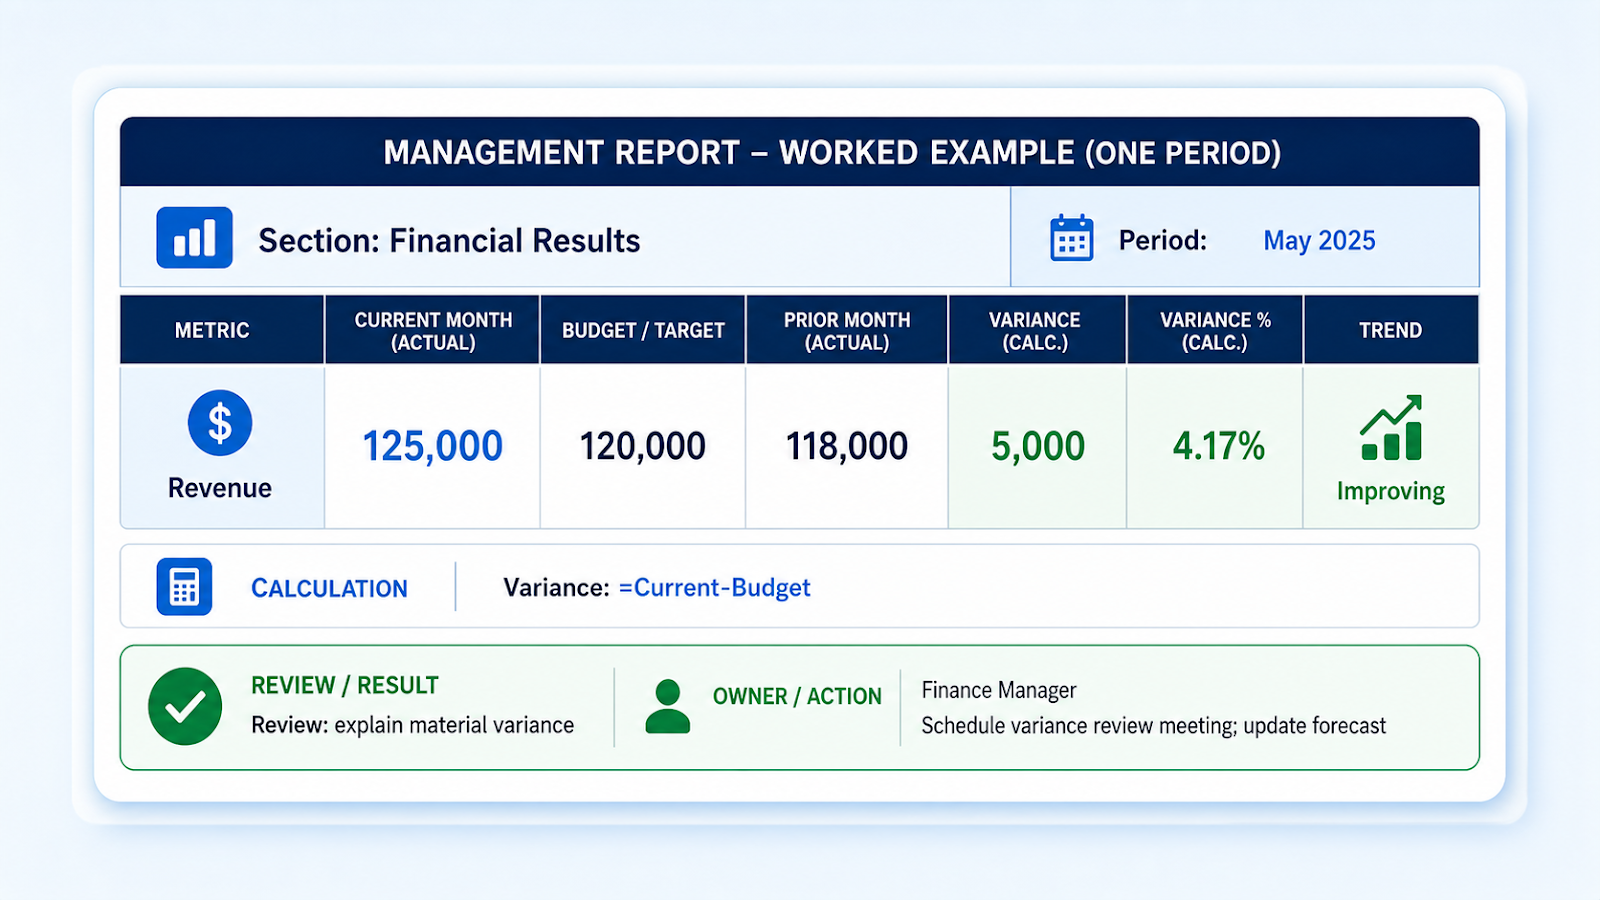
| Variance | Calculated difference between the current result and its budget or target. |
| Prior Month | Previous-period result used to show direction and recent movement. |
| Trend | Short directional view showing whether the measure is improving, worsening, or stable over time. |
| Explanation | Concise cause of a material result or variance, written so management can understand what changed. |
| Owner | Person accountable for the explanation or follow-up action. |
| Action | Concrete next step, decision, or follow-up required for a material issue. |

Build the workflow
- Define the decisions the report must support.
- Select a small set of financial and operational KPIs.
- Use one reporting period consistently.
- Highlight material variances and explain their causes.
- Add owners and actions for significant issues.
- Keep supporting detail separate from the one-page summary.
- Reconcile every headline number to its source.
For a report that compares results with targets, the monthly budget variance guide shows the same variance thinking in a focused worksheet.
Useful formulas
Variance: =Current-BudgetVariance percent: =IF(Budget=0,"",Variance/ABS(Budget))When the summary needs refreshable KPI views, continue with the PivotTable KPI dashboard tutorial.
Common tracker mistakes
| Mistake | Impact |
|---|---|
| Filling the page with every available metric | Important exceptions disappear. |
| Repeating numbers without explanation | Management cannot act on the report. |
| Mixing periods or currencies | Comparisons become invalid. |
| Using decorative charts | Visuals should answer a question. |
| Publishing before reconciliation | Trust is lost when totals disagree. |
Use materiality to decide what gets attention
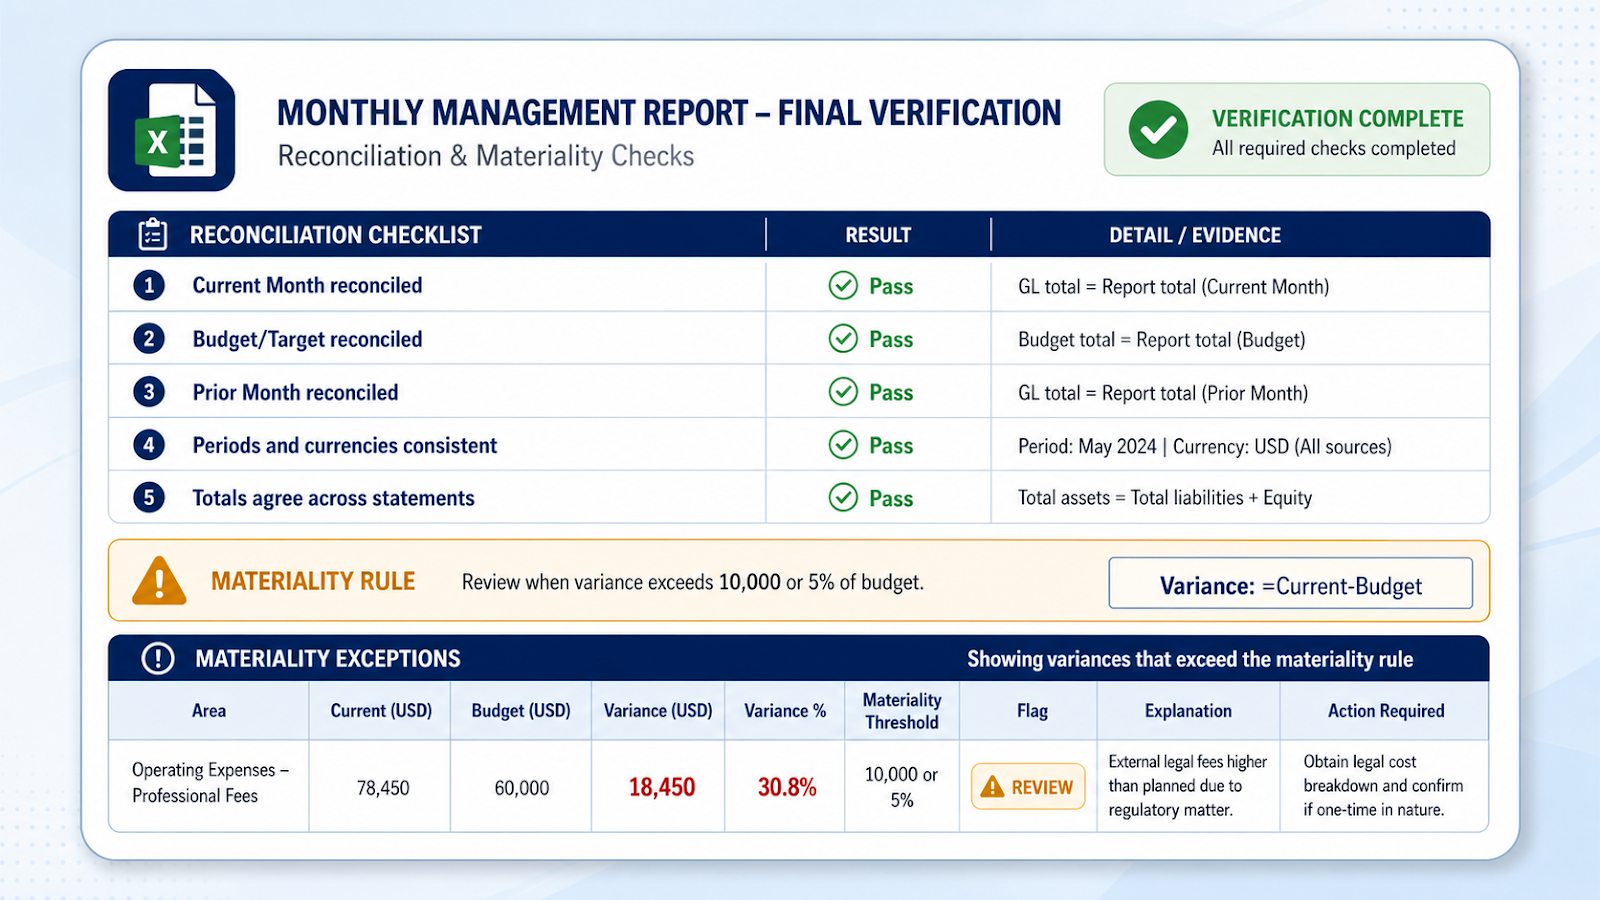
A management report should not explain every variance. Define a practical threshold such as an absolute amount, percentage, or combination of both. For example, review a variance when it exceeds 10,000 or 5% of budget, then require a short explanation and named action only for those items. This keeps the meeting focused on exceptions that can change a decision.
Reconcile the Current Month, Budget, and Prior Month values to their source before writing commentary. Separate cause from action: “Revenue below plan because two orders moved to next month” explains the result; “Owner to confirm revised shipment dates by Friday” states the next step. Trend charts should support that narrative, not repeat the same number visually. A strong one-page report lets management see result, variance, explanation, owner, and action without searching through supporting schedules.
Separate reported result from management action
A good monthly report distinguishes what happened from what will happen next. “Operating cost was 6% above budget because freight rates increased” explains the variance. “Procurement to renegotiate the carrier contract before the next cycle” assigns an action. Keeping those fields separate makes the report easier to review and prevents commentary from becoming a mixture of causes, excuses, and unowned next steps.
Frequently asked questions
How many KPIs should be shown?
Use only the measures needed for the meeting or decision, often a focused set rather than dozens.
Should the report include narrative?
Yes, brief explanations and actions add more value than numbers alone.
Can the detail be on separate sheets?
Yes. Keep the summary concise and link to supporting schedules.
How do I make it repeatable?
Use Tables, consistent source extracts, and a documented refresh checklist.
Continue building reliable Excel workflows
Browse more lessons in the OneXcel Tutorial Hub or explore free Excel resources.