
DASHBOARDS & REPORTING
How to Create a Clear Monthly Budget Variance Report in Excel
A useful variance report does more than subtract budget from actual. It shows what changed, whether the result is favorable, why the difference occurred, and what should happen next.
Core idea: calculate the difference consistently, then add enough context for a manager to understand whether the variance needs attention.
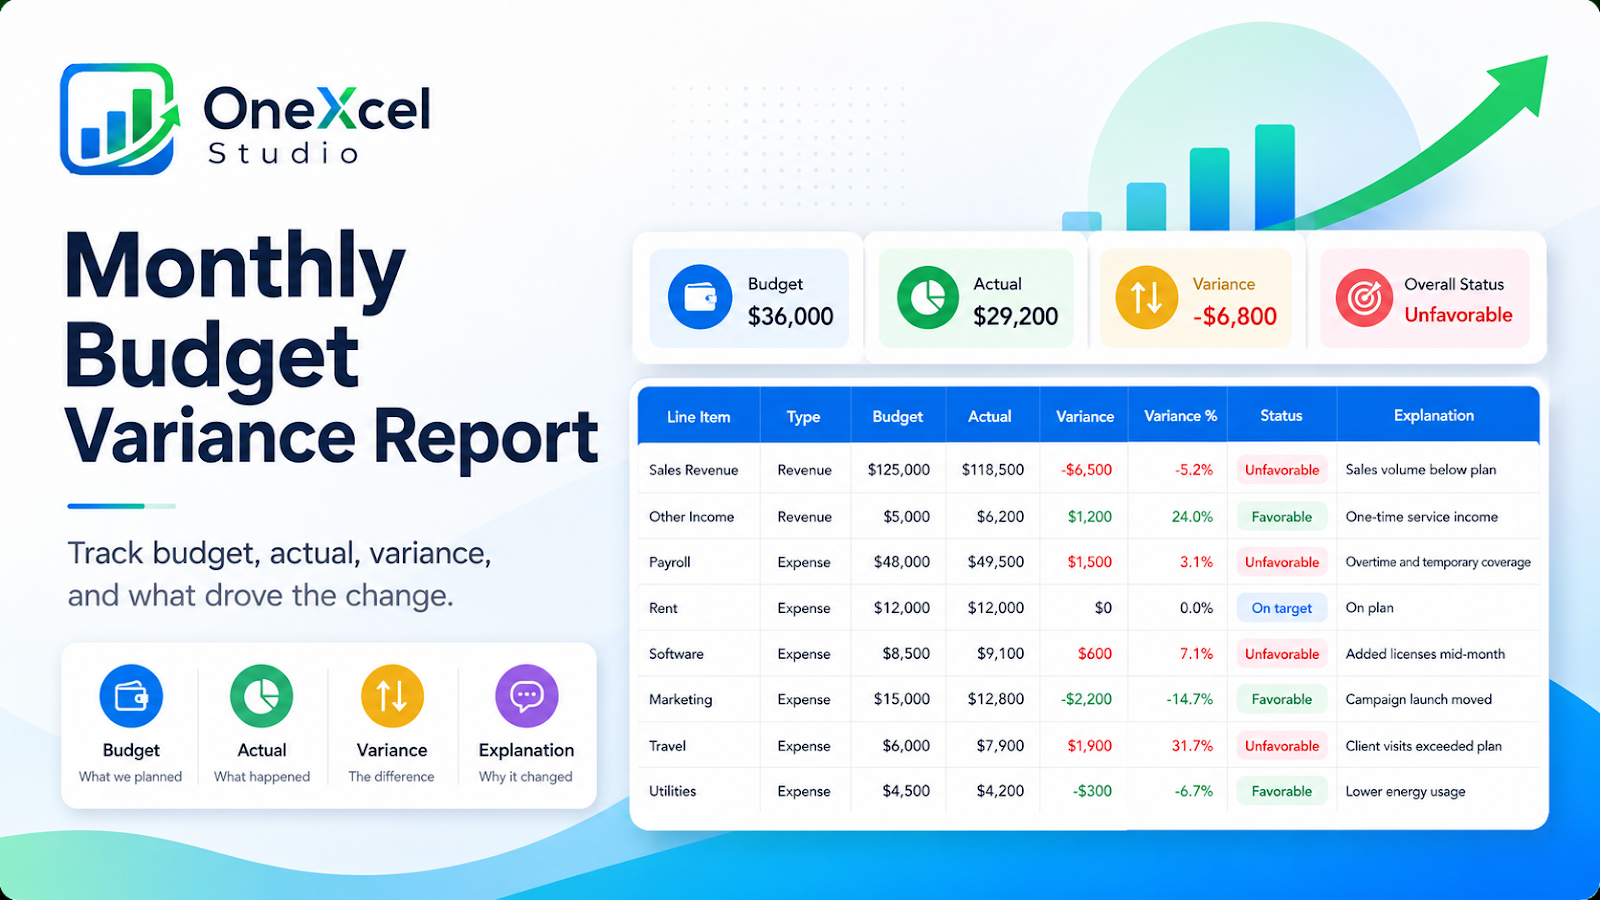
Start with a clear report structure
Use one row for each revenue or expense line. Keep the report compact enough to scan, but include the fields needed to explain the result. A practical monthly table normally contains the line item, type, budget, actual, amount variance, percentage variance, status, and a short explanation.
| Column | Purpose |
|---|---|
| Line Item | Identifies the account, category, or operational measure being reviewed. |
| Type | Distinguishes revenue from expense because favorable logic is different. |
| Budget | Shows the approved or expected amount for the period. |
| Actual | Shows the recorded result for the same period. |
| Variance | Measures the amount difference between actual and budget. |
| Variance % | Shows the difference relative to the budget amount. |
| Status | Labels the result as favorable, unfavorable, or on target. |
| Explanation | Records the operational reason behind the difference. |
1. Calculate the amount variance
A simple and consistent starting formula is Actual − Budget. In a table where Budget is in column C and Actual is in column D, the row formula is:
=D5-C5The sign alone does not tell you whether the result is good or bad. A positive revenue variance is normally favorable because actual revenue exceeded budget. A positive expense variance is normally unfavorable because spending exceeded budget. Keep the calculation consistent and handle the interpretation separately.
2. Calculate the variance percentage
The percentage helps compare items with very different budgets. Divide the amount variance by the absolute budget so the denominator stays positive:
=IF(C5=0,"",E5/ABS(C5))Using ABS prevents a negative budget from reversing the meaning of the percentage. The IF check avoids a divide-by-zero error when the budget is blank or zero. For zero-budget items, review the amount variance directly and decide whether a percentage is meaningful.
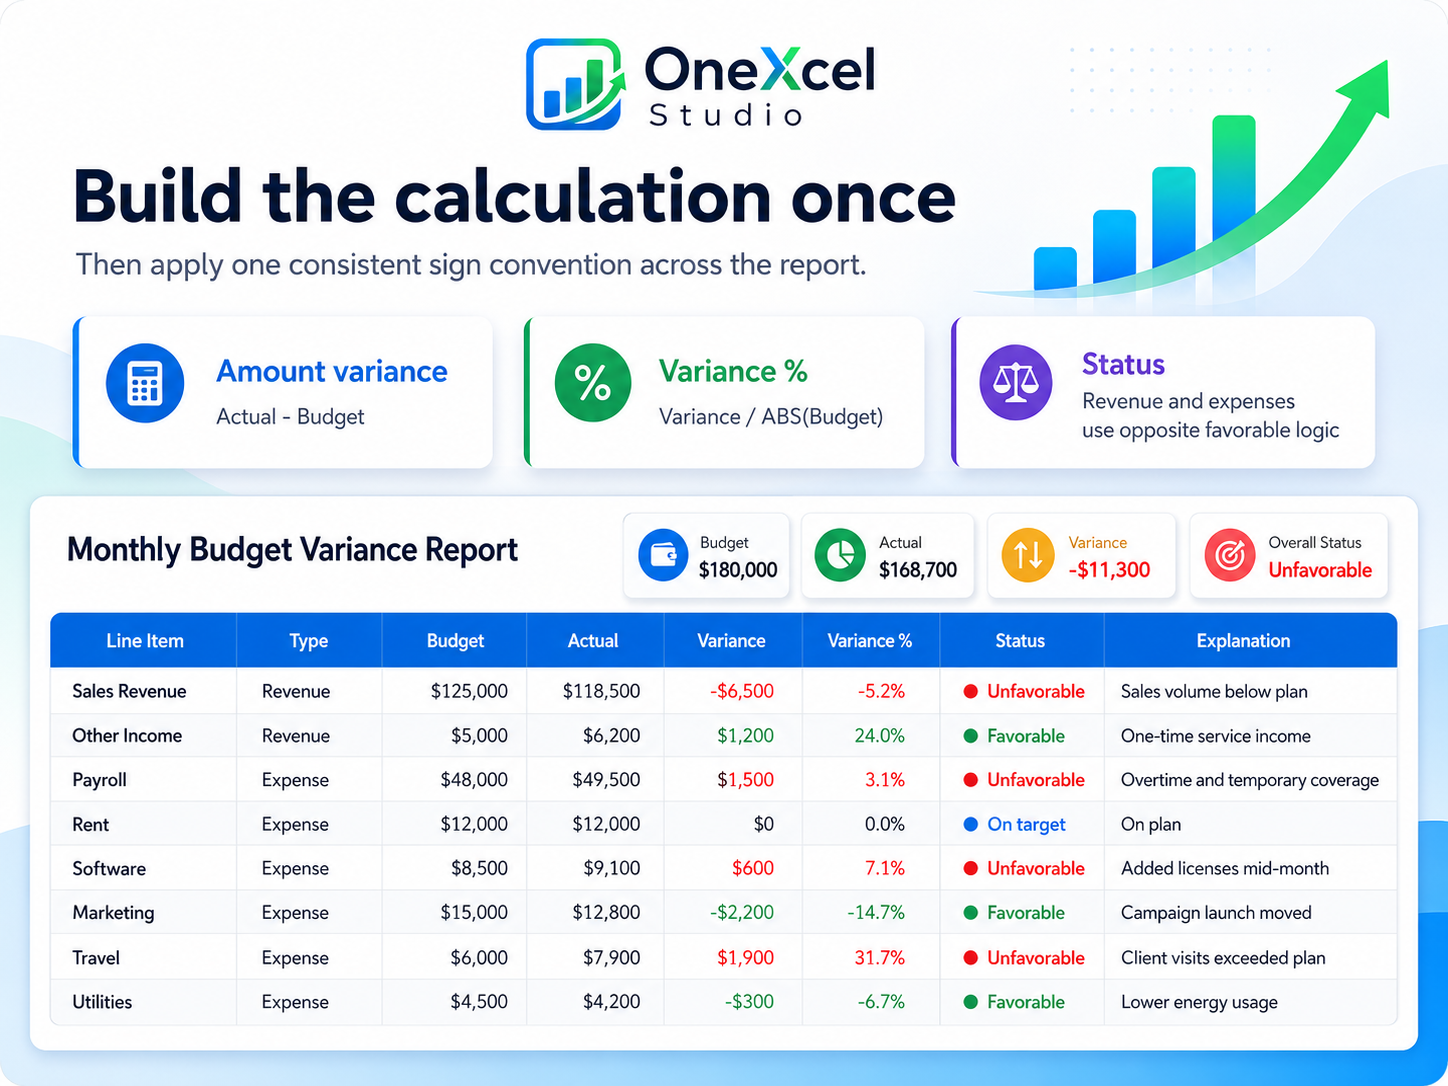
3. Apply the favorable and unfavorable logic
Do not use one universal rule for every row. Revenue and expenses move in opposite directions. You can calculate the status with a formula, or keep the formula simple and use a separate lookup rule.
| Type | Positive variance | Negative variance |
|---|---|---|
| Revenue | Usually favorable | Usually unfavorable |
| Expense | Usually unfavorable | Usually favorable |
Important: favorable does not always mean desirable. Lower training, maintenance, or marketing spending may be favorable to budget but harmful to operations. The explanation column should capture that context.
4. Focus attention with a materiality threshold
Not every difference deserves the same amount of discussion. Use a materiality rule so reviewers focus on the largest or most important items. A simple rule might flag a row when the amount variance exceeds $1,000 or the percentage exceeds 5 percent.
=OR(ABS(E5)>1000,ABS(F5)>5%)The threshold should match the size and risk of the organization. A fixed amount works well for major accounts, while a percentage helps identify smaller categories with unusually large movement. Many reports use both.
5. Add a short explanation
The explanation turns the report from a calculation sheet into a management tool. Keep it specific and operational. “Over budget” repeats the number and adds no insight. “Overtime and temporary coverage during staff absence” explains the reason and supports a follow-up discussion.
Weak explanation
“Travel was unfavorable.”
Useful explanation
“Client visits exceeded plan; two trips were moved forward from next month.”
6. Add ownership and next action when needed
For significant unfavorable items, add an owner and next action. The report does not need a long project plan, but it should make the follow-up clear. Examples include validating an invoice, updating the remaining forecast, approving a revised spending plan, or investigating a recurring operational issue.
- Owner responsible for the explanation or follow-up
- Action required
- Expected completion date
- Forecast impact on the remaining months
7. Add a small summary, not a crowded dashboard
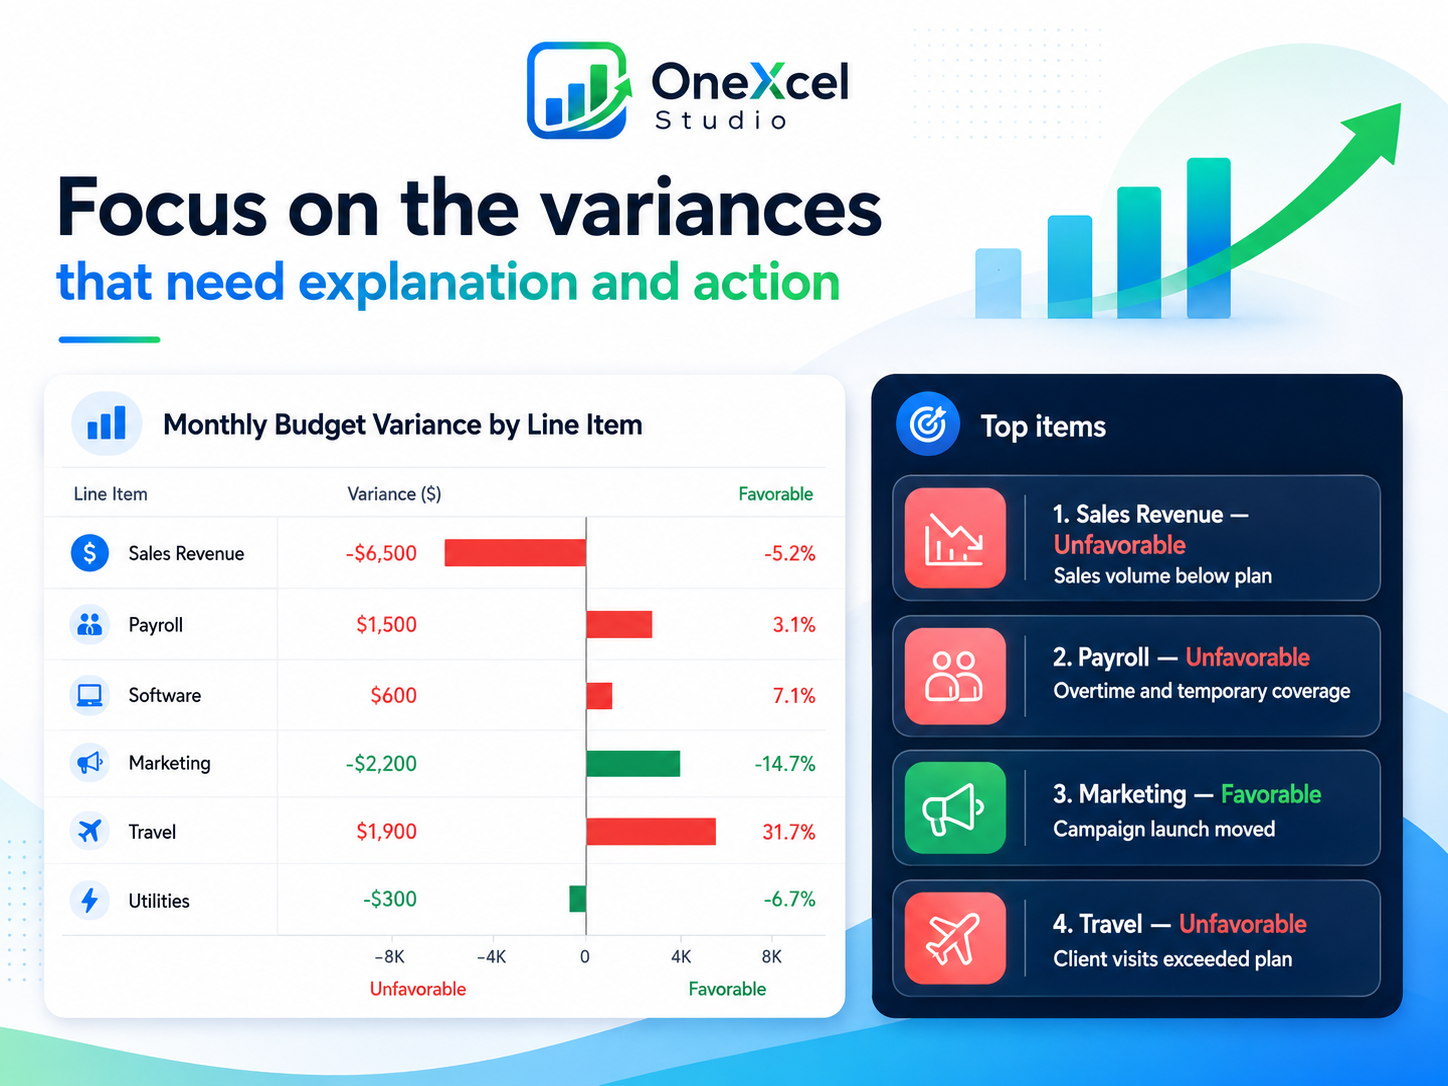
A monthly variance report benefits from a few headline values: budget result, actual result, total variance, and overall status. Add one focused chart showing the largest favorable and unfavorable items. Avoid filling the page with decorative charts that repeat the same table.
Sort or rank by absolute variance when you need to identify the items that matter most. A horizontal bar chart is useful because it supports long line-item labels and makes the direction of the variance easy to compare.

Use conditional formatting for attention, not decoration
Apply color only after the status logic is correct. Use a restrained green treatment for favorable items, a clear warning treatment for unfavorable items, and a neutral style for rows that are on target. Keep the text label visible so the report still works when printed, viewed in grayscale, or reviewed by someone who does not rely on color.
Conditional formatting should direct attention to material differences, not paint every number. A report with too many colors makes the important exceptions harder to find.
Final review checklist
- Budget and actual cover the same period.
- Amount variance uses one consistent formula.
- Percentage variance handles zero budgets safely.
- Revenue and expense status logic is applied correctly.
- Material items include a clear explanation.
- Significant unfavorable items include an owner or action.
- Totals agree with the source accounting or operating report.
- The report can be refreshed without manually rewriting formulas.
Frequently asked questions
Should variance be Budget minus Actual or Actual minus Budget?
Either convention can work. The important requirement is consistency. This guide uses Actual minus Budget, then interprets the result according to whether the row is revenue or expense.
How should I treat a zero budget?
Show the amount variance and leave the percentage blank or label it separately. Dividing by zero is not meaningful, and a very small placeholder denominator can create a misleading percentage.
Should favorable variances always be green?
Color can help, but it should not replace the status label. Use accessible text such as Favorable and Unfavorable, and reserve strong color for the items that need attention.
Can this report be built with an Excel Table?
Yes. An Excel Table helps formulas fill down automatically when new rows are added and makes structured references easier to read. Keep totals and summary visuals outside the detail rows.
Build reports that lead to action
Continue with the Tutorial Hub or explore OneXcel’s free Excel resources.