
TEMPLATES & BUSINESS WORKFLOWS
How to Build a Sales Pipeline Tracker in Excel
Build an Excel sales pipeline tracker with opportunity stages, probabilities, expected values, owners, and next actions.

Recommended tracker fields
| Field | Purpose |
|---|---|
| Opportunity ID | Stable deal key used to prevent duplicates and preserve history as the opportunity moves stages. |
| Account | Customer or prospect account connected to the opportunity. |
| Opportunity | Short description of the specific deal or sales outcome being pursued. |
| Stage | Controlled sales stage that shows where the deal sits in the approved process. |
| Probability | Approved stage-based or controlled win probability used for weighted planning. |
| Estimated Value | Gross potential value of the opportunity before probability weighting. |
| Expected Value | Calculated planning value from Estimated Value multiplied by Probability. |
| Expected Close | Current planned close date used for period forecasting and stale-deal review. |
| Owner | Salesperson accountable for moving the opportunity to its next outcome. |
| Next Action | Specific next selling action that should move the opportunity forward. |
| Last Contact | Date of the most recent meaningful customer contact, used to flag stale opportunities. |
| Risk | Key blocker or uncertainty that could delay, reduce, or prevent the expected outcome. |

Build the workflow
- Create one row per opportunity.
- Use controlled stage and probability rules.
- Record estimated value and expected close date.
- Assign an owner.
- Keep the next action and last-contact date current.
- Calculate expected value.
- Review stage movement and stale opportunities weekly.
Useful formulas
Expected value: =[@[Estimated Value]]*[@Probability]Stale flag: =IF(TODAY()-[@[Last Contact]]>14,"Follow up","")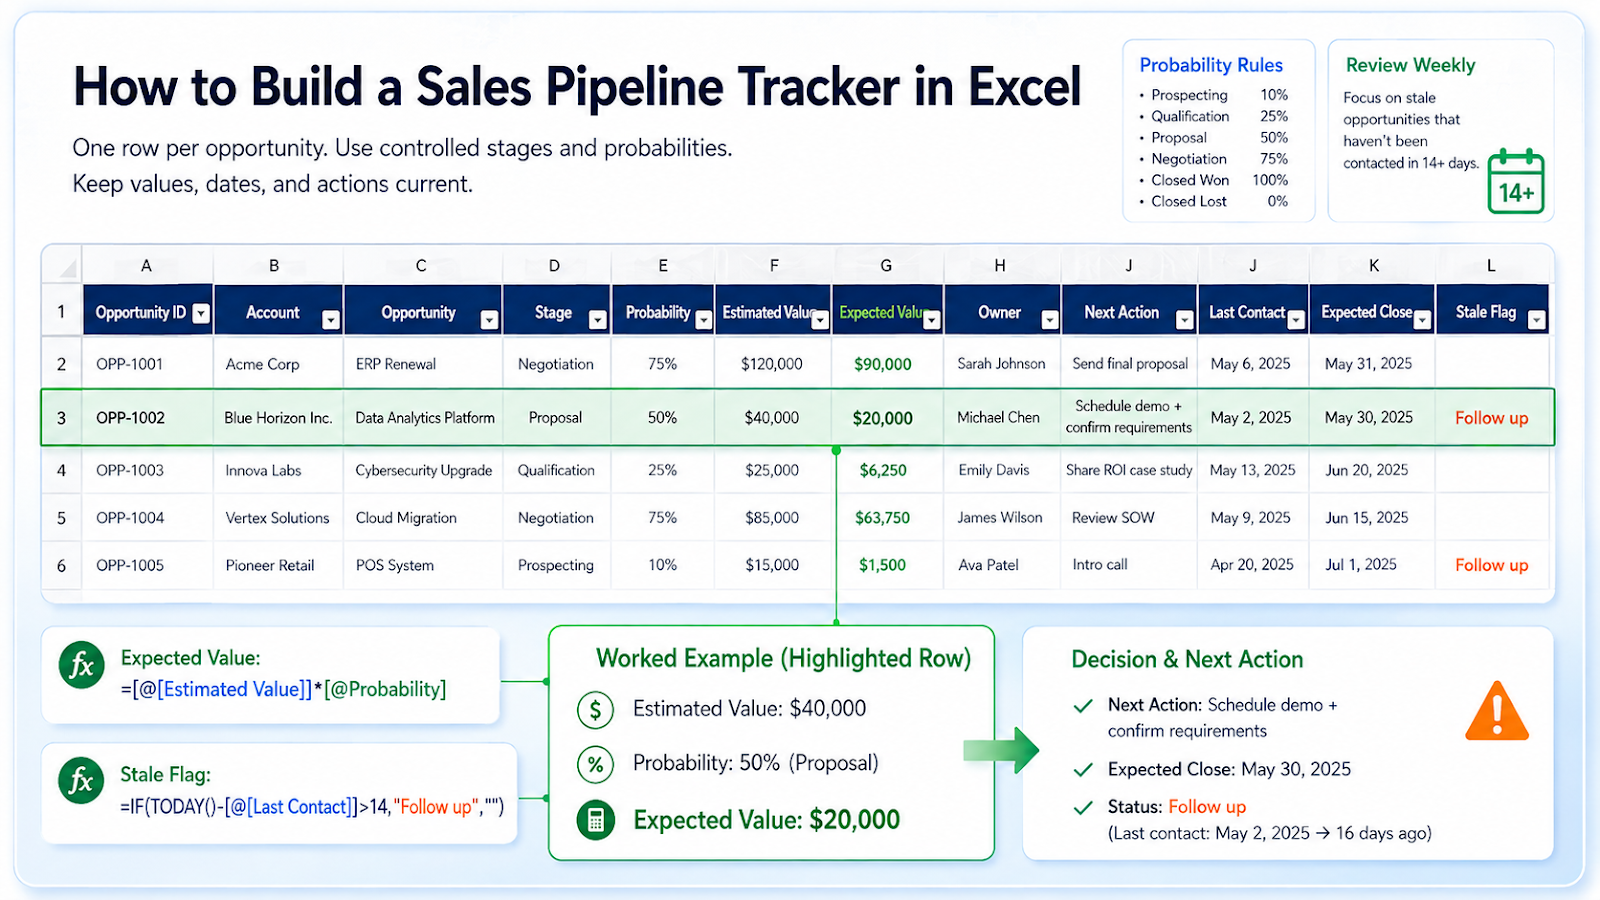
Common tracker mistakes
| Mistake | Impact |
|---|---|
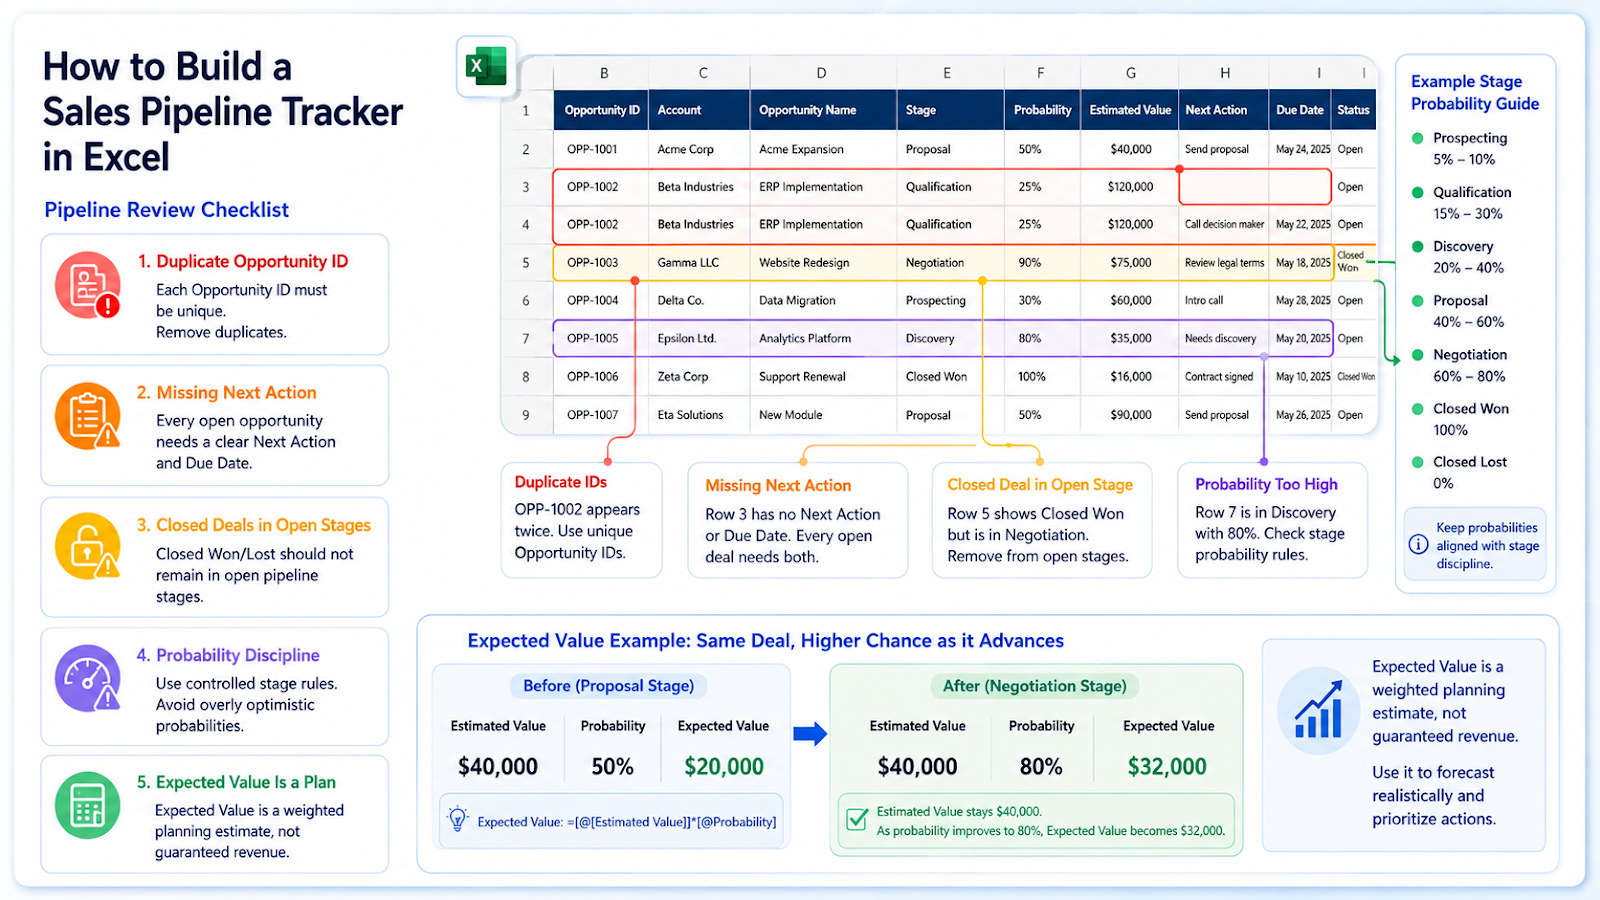
| Using optimistic probabilities without stage rules | The forecast becomes subjective. |
| Leaving next action blank | The tracker describes deals but does not drive work. |
| Keeping closed deals in open stages | Pipeline totals are inflated. |
| Counting duplicate opportunities | Imports and handoffs can create repeats. |
| Treating expected value as guaranteed revenue | It is a weighted planning estimate. |
Worked pipeline example
Suppose a 40,000 opportunity is in a stage assigned a 50% probability. Expected Value is 20,000. If the deal moves to a later stage with an 80% approved probability, the expected value becomes 32,000 without changing the original estimated value. This keeps the forecast calculation transparent.
Stage probabilities work best as controlled defaults rather than salesperson guesses entered independently on every row. Review opportunities with no Next Action, no recent contact, or a close date already in the past. Those quality checks often improve the forecast more than adding another chart. Keep Won and Lost records for history, but remove them from open-pipeline totals with a clear status rule. Expected Value is a planning measure, not a promise of revenue, so show both weighted and unweighted pipeline when management needs context.
Review pipeline quality, not only pipeline value
Weighted pipeline can look healthy while the underlying opportunities are stale. Add simple quality checks such as no Next Action, last contact older than the approved threshold, expected close date in the past, or stage unchanged for too long. A weekly sales review can filter those records before discussing forecast totals. This makes the tracker useful as a selling workflow rather than just a static CRM-style list.
Frequently asked questions
Should probability be manual or stage-based?
A stage-based default improves consistency, with controlled overrides when justified.
How do I track products within one deal?
Use a separate line-item table linked by Opportunity ID.
Can I chart the funnel?
Yes, but show both deal count and value so one does not hide the other.
How often should the pipeline be reviewed?
At a consistent sales cadence, with stale-record checks.
Continue building reliable Excel workflows
Browse more lessons in the OneXcel Tutorial Hub or explore free Excel resources.